|

|
Data is information coming from survey responses, observations, experimental measurements, or counts, that is collected for reference or analysis. |
 Types of Data: Types of Data: |
|
Statistical data can appear in two forms:
• Data values can be numbers, referred to as quantitative data.
Quantitative data can be counted or measured. Mathematical operations can be performed on quantitative data. It offers information on a numerical scale.
•
Data values can be names or labels, referred to as qualitative data (or categorical data).
Qualitative data can not be used in mathematical operations. It can be grouped in categories and ordered, but it cannot be counted or measured by a numerical scale.
Data values can be numbers which act as names instead of numbers (such as phone numbers with dashes: 300-453-1111 or zip code numbers), making them qualitative data. |
Data values, of any kind, without their context are useless. A list of numbers
is of little importance if it is not known to what the numbers apply.
|
Quantitative Data |
• Deals with numbers.
• Also referred to as Numerical Data.
• Data which can be measured.
• Height, weight, area, volume, length, time, temperature, speed, cost, etc.
• Quantitative → Quantity
|
|
Quantitative Data:
• weight 1.83 ounces
• 280 calories
• length 10 cm
• width 3 cm
• height 1.8 cm |
|
|
Quantitative Data:
• 38 students
• 3 field trips per year
• average GPA 3.5
• 20 girls, 18 boys
• 3 foreign exchange students |
|
Example 3:
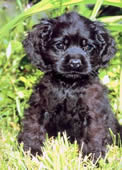
Cocker
Spaniel
Puppy
|
 |
Quantitative Data:
• adult weight 28 pounds
• life span 15 years
• height 15 inches
• hip dysplasia ranking 115 *good
• shelter price $200 |
|
|
Qualitative Data |
• Deals with names, labels, descriptions.
• Also referred to as Categorical Data.
• Data which can not measured.
• Eye color, smells, car models, textures, tastes, favorites, candy bars, etc.
• Qualitative
→ Quality |
|
Qualitative Data:
• dark chocolate
• contains peanuts
• caramel smell
• brown wrapper
• nougat center |
|
|
Qualitative Data:
• charity work
• friendly atmosphere
• vocal concerts
• produce a Spanish Play
• enjoy Spanish food |
|
Example 3:
Cocker
Spaniel
Puppy
|
 |
Qualitative Data:
• color black
• trusting
• fluffy
• baby smell
• likes to be held |
|
|
 Number of Variables in Data: Number of Variables in Data: |
Univariate data means "one variable" (one type of data).
Bivariate data means "two variables" (two types of data).
Univariate Data |
• Deals with one variable.
• Major purpose is to describe.
• No relationships or causes.
|
Statistical Analysis:
• measures of central tendency - mean, mode, median
• outliers and interquartile range
•
range, maximum, minimum, variance, quartiles, mean absolute deviation, standard deviation
• shape, center, spread or distributions
|
Displays:
•
Dot Plots
• Histograms
• Box Plots
• Quartiles
• Standard Deviation
|
Example:
How many students in the freshman class own a skateboard? |
|
Bivariate Data |
• Deals with two variables.
• Major purpose is to explain.
• Relationships and causes. |
Statistical Analysis:
• correlations
• comparison, causes, relationships, explanations
• analysis of 2 variables simultaneously
• tables showing one variable depending upon the other variable
• independent and dependent variables |
Displays:
• Scatter Plots
• Line of Best Fit
• Linear Regressions
• Two-Way Frequency Tables
• Residuals (not in NGMS) |
Example: Is there a relationship between the number of skateboards a freshman owns and his/her final test score in Algebra 1? |
|

NOTE: The re-posting of materials (in part or whole) from this site to the Internet
is copyright violation
and is not considered "fair use" for educators. Please read the "Terms of Use". |
|