|
Directions: Read carefully.
1. |
Which of the function definitions shown below will produce the graph at the right?
|
|
|
2. |
Regarding the graph at the right:
a) What is the domain?
b) What is the range?
|
|
| |
c) Which function definition will produce this graph?
|
|
3. |
According to the United States Postal Service (in 2014), first-class letters are weighed and priced as shown in the chart at the right.
Which of the following graphs correctly displays this information regarding the pricing of first-class letters?
|
First-Class Mail - Letters
Weight Not Over (ounces) |
Cost |
1 |
$0.49 |
2 |
$0.70 |
3 |
$0,91 |
3.5 |
$1.12 |
Source: US Postal Service (2014) |
| |
Choose:
|
|
4. |
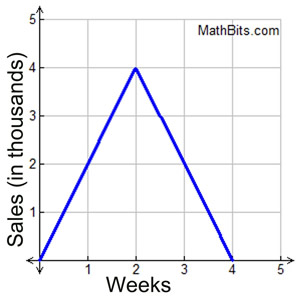
The sales s, in thousands, of a new record album increases steadily for a while and then decreases just as quickly. This information is graphed at the right.
a) What type of graph is being used to present this information?
Choose:
|
 |
| |
b) What was the maximum number of albums sold in one week?
Choose:
c) What is the average rate of change in the album sales during the first two weeks?
Choose:
|
|
5. |
The graph at the right is a transformation of the absolute value function, f (x) = | x |.
a) Which of the following equations represents this graph?
Choose:
|
|
| |
| |
b) On which intervals is the function positive?
Choose:
|
| |
c) What is the absolute minimum of this function?
Choose:
|
| |
d) Which choice is an end behavior for this function?
Choose:
|
|
6. |
A cell phone plan charges by the number of minutes of usage, as shown in the chart.
• $10 for the first 30 minutes.
• increases of $2 for each 10 minute interval thereafter.
a) What is the missing value from the chart?
Choose:
|
Minutes of Use, m |
Total
Cost |
0<m<30 |
$10 |
30<m<40 |
$12 |
40<m<50 |
? |
50<m<60 |
$16 |
60<m<70 |
$18 |
|
|
| |
b) What type of function should be used to depict this plan, based on minutes of use?
Choose:
|
|
| |
c) Graph this function. |
|
|
7. |
A company produces ID badges for local businesses. The company charges $50 for the initial badge template, $15 per badge for orders of 10 or fewer badges, and $12 per badge for orders of more than 10 badges.
a) What is the cost for ordering 25 badges?
Choose:
|
|
| |
| |
b) What type of function should be used to depict this plan, based on the number of badges ordered?
Choose:
|
| |
c) Graph this function.
|
|
|
8. |
A family leaves on a car trip. They start the car and steadily accelerate to the city speed limit of 30 mph over the first minute of travel. They continue at 30 mph for the next 5 minutes, until they reach the city limits. At the city limits, they steadily accelerate to the state speed limit of 55 miles per hour over two minutes. They continue at 55 mph for the next 22 minutes until reaching the neighboring city.
|
| |
| |
a) How long did it take the family to reach the neighboring city?
Choose:
|
|
| |
|
| |
c) Graph this function, using time on the x-axis and miles per hour on the y-axis. |
|
|

NOTE: The re-posting of materials (in part or whole) from this site to the Internet
is copyright violation
and is not considered "fair use" for educators. Please read the "Terms of Use". |
|
|