Practice Page
Directions: Read carefully. Grab your calculator.

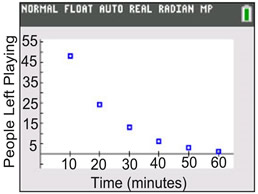
  1.  Participants are being eliminated every 10 minutes from a gaming competition. The data is shown in the chart at the right, with a calculator scatter plot below the chart.
a)
Examine the scatter plot. Which type of regression model will be the best fit for this data?
Choose:
linear regression
 
exponential regression
 
quadratic regression

b)
Which choice is the regression equation?
Choose:
y = 112.26(0.93)x
 
y = -0.87x + 46.33
 
y = 0.03x2 - 2.65x + 70
Time
(minutes)
People Left Playing
10
48
20
24
30
13
40
6
50
3
60
1

FitPLOTA


  2.  Kevin is biking to visit his friend who lives in a nearby town. The data is shown in the chart at the right, with a calculator scatter plot below the chart.
a) Examine the scatter plot. Which type of regression model will be the best fit for this data?
Choose:
linear regression
 
exponential regression
 
quadratic regression

b)
Which choice is the regression equation?
Choose:
y = 1.80(1.41)x
 
y = 2x + 2
 
y = 2x
Hours of Travel
Miles from Home
1
2
2
4
3
6
4
8
5
10
6
12

fitPlotB


  3.  Two data sets are being compared. The data is shown in the chart at the right, with a calculator scatter plot below the chart.
a)
Examine the scatter plot. Which type of regression model will be the best fit for this data?
Choose:
linear regression
 
exponential regression
 
quadratic regression

b)
Which choice is the regression equation?
Choose:
y = 5(1)x
 
y = 0x + 6
 
y = x2 - 8x + 18
Data A
Data B
1
11
2
6
3
3
4
2
5
3
6
6
7
11

FitPlotC


divider

NOTE: The re-posting of materials (in part or whole) from this site to the Internet is copyright violation
and is not considered "fair use" for educators. Please read the "Terms of Use".